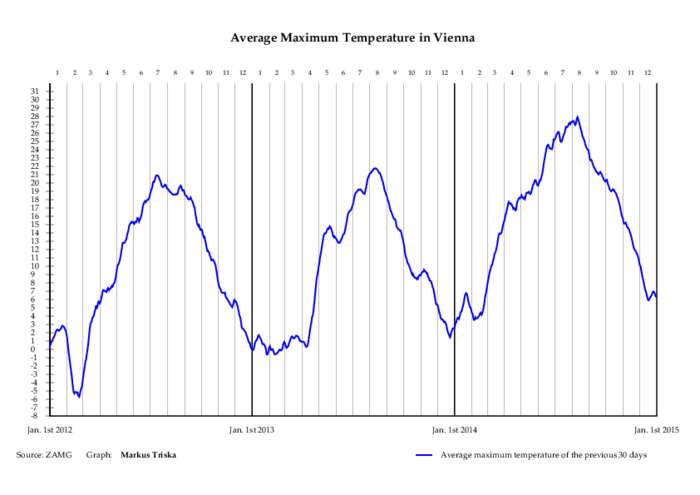
Average maximum temperature in Vienna (2012-2014)
Using PostScript, you have full control over all aspects of your
graphs, and can readily perform computations with the input data.
In this case, the source data is contained
in temperatures.ps. It comprises the
respective daily maximum temperature in Vienna for each day from
Jan. 1st 2012 to Dec. 31st 2014.
With a few additional lines of PostScript, you can turn this into
a scalable graph: temperature.pdf.
It looks like this:
Main page